Satellite trail identification in GalaxyZoo images
Last year I attended the .dotastro 5 conference in Boston (and I will be at the successor, .dostastro 6 this year in Chicago). It was a really fun conference to attend, since astronomy is a field I’m trying to eventually be able to contribute to in a non-amateurish way. Coming from the computational side of the house, what better way to jump in than to find some interesting computational problems that are relevant to the astronomy community!
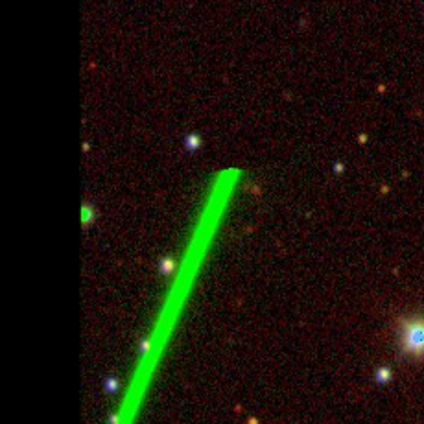
On hack day at the conference, I joined in with the group working on the ZooniBot - a program developed the previous year to aid the users of the Zooniverse forums by automatically answering questions without the need for moderators to manually jump in and respond. Early in the day on Hack Day, I asked people in the room what would be useful things for ZooniBot to be able to do that it couldn’t already do. While I didn’t spend much time on it on Hack Day, one of the problems that I really liked and has followed me since then was suggested by Brooke Simmons and is intended to address a common question that comes up on the GalazyZoo site. Consider the following image:
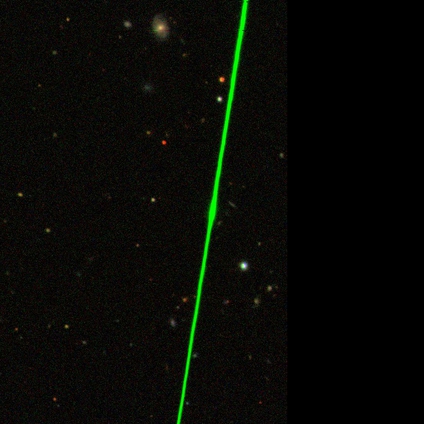
To the eye of a Zooniverse user who is new to the Galaxy Zoo, it is quite likely that this would stand out as unusual. What is the streak? These common artifacts are caused by satellites zipping along in the field of view while the image was being captured. A satellite appears as a bright streak that flashes across the image, and due to its speed, frequently traverses the frame while one color filter is engaged - which is why the bright streaks tend to look green. Of course, a few lucky satellites wandered past while other filters were engaged.
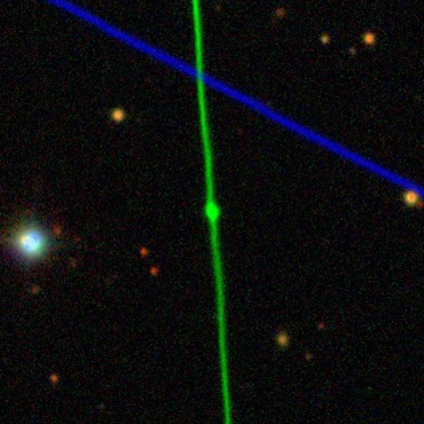
In some cases, two artifacts crossed the field of view resulting in trails of different colors.
How do we build an automatic system that can inform curious GalaxyZoo users that these images contain satellite trails? Given that the image data set is huge and unannotated with metadata about what kinds of artifacts that they contain, such a question requires the automatic system to look at the image and perform some kind of image analysis to make a guess as to whether or not the image contains an artifact like a trail. At first blush, this seems relatively straightforward.
For this specific kind of artifact, we can make a couple of observations:
- The artifacts appear as straight lines.
- The artifacts commonly appear in one color channel.
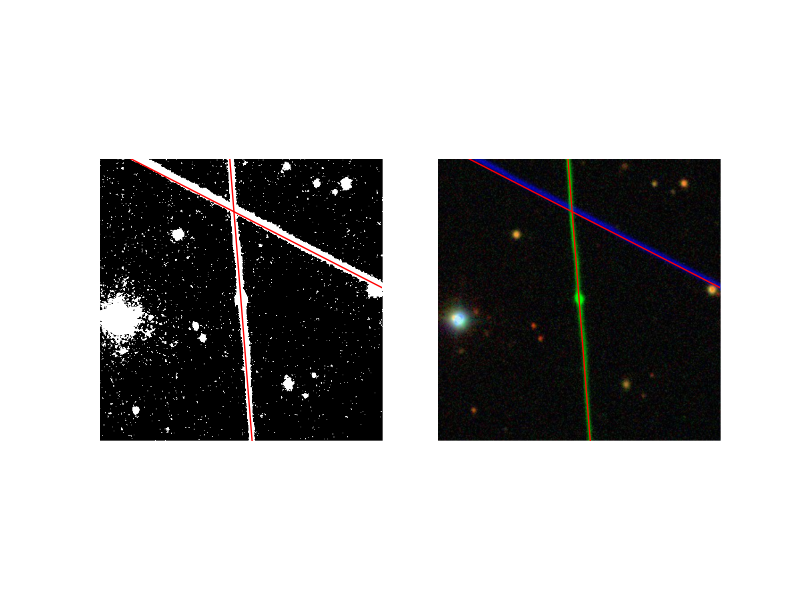
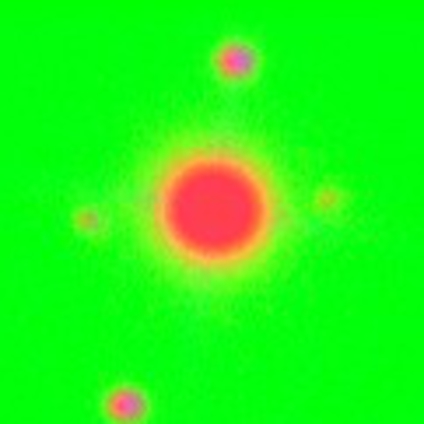
The natural building block for an automated detector is the Hough transform. The basic concept behind the Hough transform is that we can take an image and compute its corresponding Hough image. For example, in the example of the two lines above, the corresponding Hough image is:
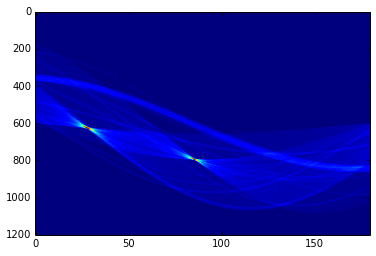
In the source image, we have a set of pixel values that have an (x,y) location as well as an intensity value in each of the color channels (r,g,b). Before applying the Hough transform, we map each pixel to a binary value indicating whether or not the pixel is bright enough to be considered on or off. This is achieved by applying some form of image segmentation that maps the RGB image to a binary image. In this example, I used Otsu’s method for computing the best threshold for each image. Once the binary image is available, the Hough transform looks at every line that goes through the image by varying the angle of the line over [0,pi], and for every offset from the upper left corner of the image to the upper right corner. The results is the Hough image we see above, where the X axis corresponds to the angle, and the Y axis corresponds to the line offset. The intensity for each angle/offset combination is the number of pixels that were set to 1 in the binary image along the corresponding line. As we can see, there are two bright spots. Looking more closely at the lines that correspond to those bright spots (known as “Hough peaks”), we see that they match relatively well to the two lines that we see in the blue and green channels.
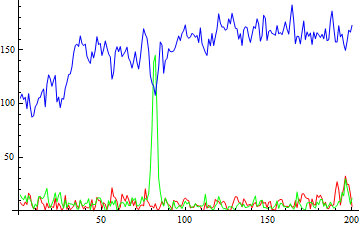
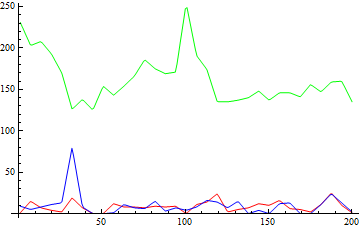
Once we’ve applied the Hough transform to identify the lines in an image, we can then extract out the pixel values in the original image along the detected lines. For example, from the image above where we had two lines (one blue, one green), we can see the intensity in each of the three color channels in the plots below.
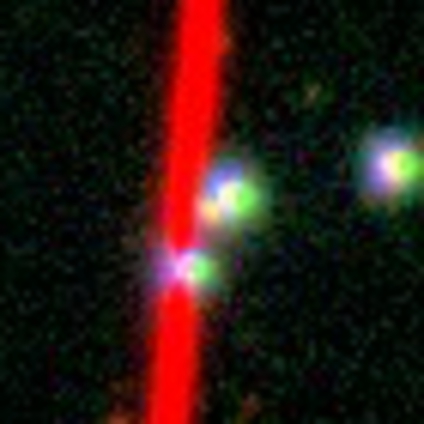
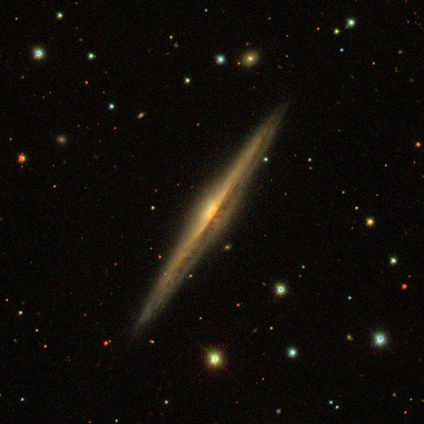
Once we have extracted lines, we are left with a set of candidate lines that we’d like to test to see if they meet the criteria for being a trail. The important thing to do is filter out line-like feature that appear that aren’t actually trails, like galaxies that are viewed edge-on. For example, the following image will yield a strong line-like feature along the center of the galaxy.
A simple filter is achieved by taking all pixels that lie upon each detected line and computing some basic statistics - the mean and standard deviation of the intensity along the line. If our goal is to find things that are dominant in one color channel, then we can ask the following: is the mean value for one color channel significantly higher than the other two channels? The heuristic chosen in the filter currently tests if the channel with the highest mean is at least one standard deviation (computed on its intensities) from the others.
Unfortunately, the data set has curveballs to throw at this test. For example, sometimes trails are short and don’t span the full image.
These trails are harder to detect with a basic heuristic on the mean and standard deviation of intensities along the line since the portion of the detected line that covers the region of the image where the trail is missing drag the mean down and push the standard deviation up. Even worse, there are images that for whatever reason have saturation in a single channel all over the image, meaning that any line that is detected ends up passing the heuristic test.
Clearly something a bit more discerning than heuristics based on basic summary statistics is necessary. This work is ongoing, and will hopefully eventually lead to something of value to the GZ talk community. In the meantime, I’ve put the code related to this post up on github for folks curious about it. If this topic if of interest to you, feel free to drop me an e-mail to see what the status is and what we’re currently up to with it. I’m eager to see what new problems like this that .dotastro 6 will send my way.